Data Visualization 21: Plants for the climate
We develop a playful and creative interaction where visitors can learn more about the carbon cycle, and understand the effect of reforestation on the climate. Research data is visualised and facilitated through the engagement of the visitor. Using the interactive maps developed by the Crowther lab, visitors predict how the carbon cycle and climate will change under increasing human pressure, and how we might restore earth’s ecosystems in the fight against climate change. By using these visualised data, by interacting and playing, the visitor becomes part of the global ecosystem and the worldwide reforestation project. At the same time, they experience the haptic, emotional and aesthetic effect of plants, tapping into the natural fascination humans have for forests. This exhibit should both instil hope and inspire action.
Student projects:
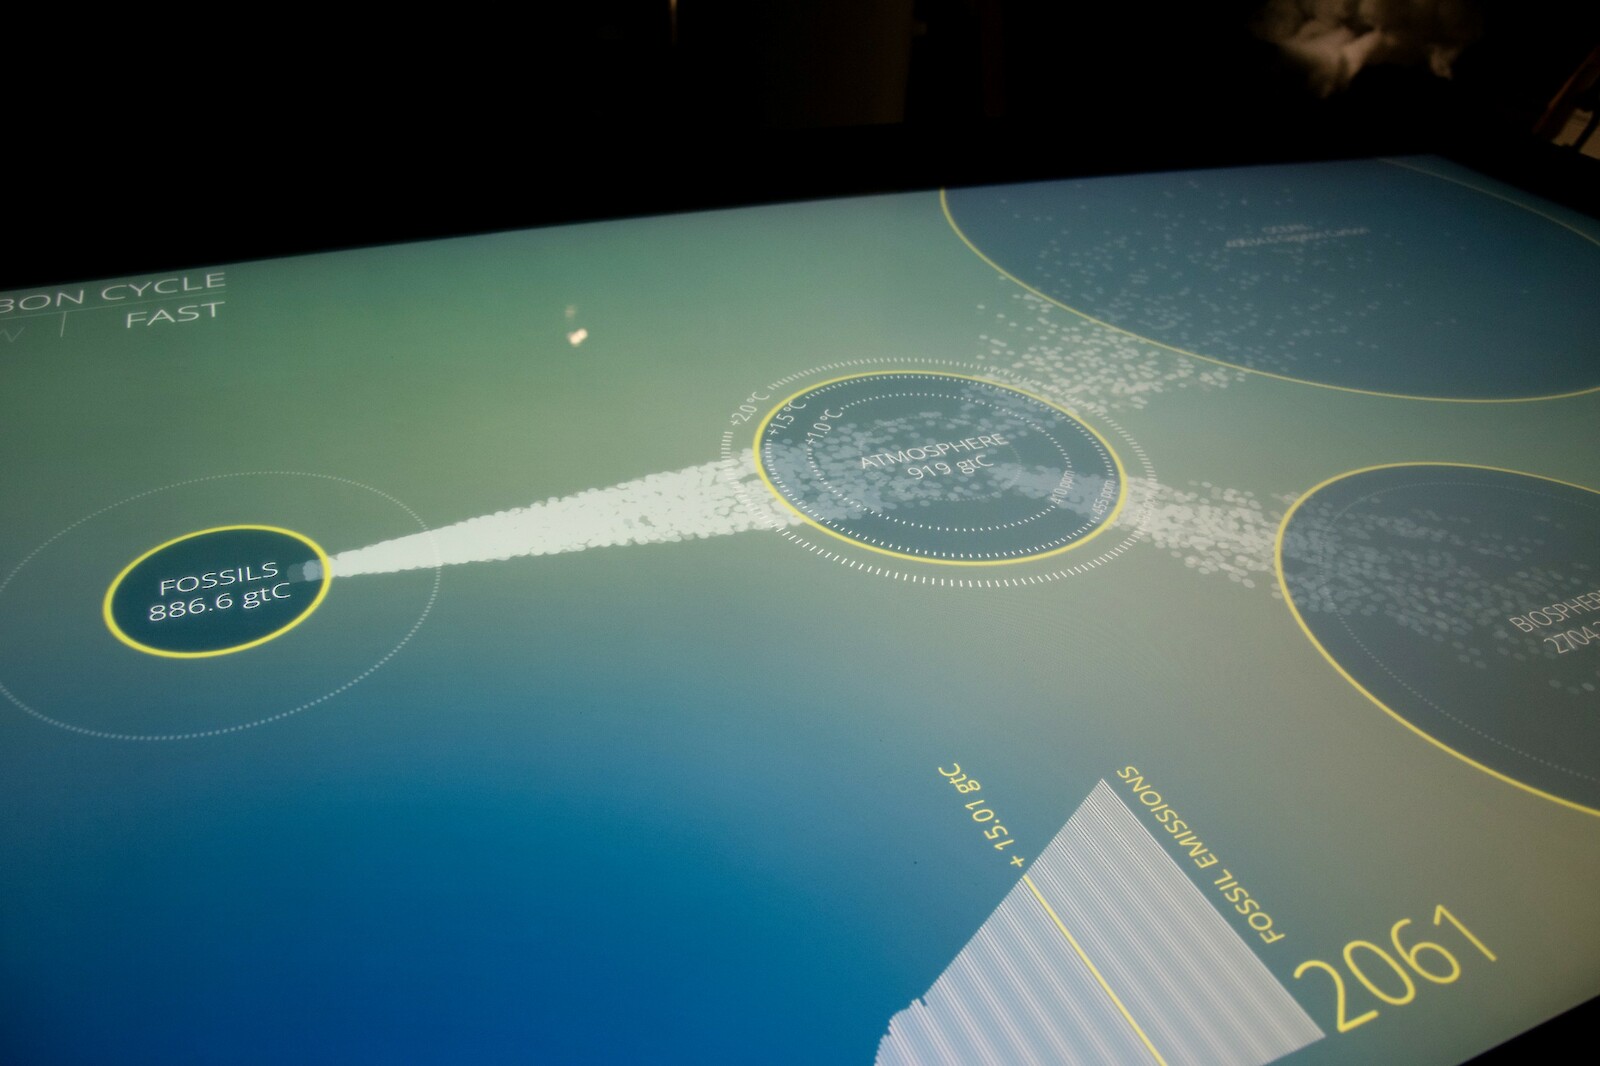
There is not one, but two separate natural systems on earth constantly moving around massive amounts of carbon. Knowing that there is a slow and a fast domain of the carbon cycle is crucial in understanding why the use of fossil fuels has as big an impact as it has on the environment. Though a simplification, THE CARBON CYCLES tries to convey the science behind the call for zero fossil emission.
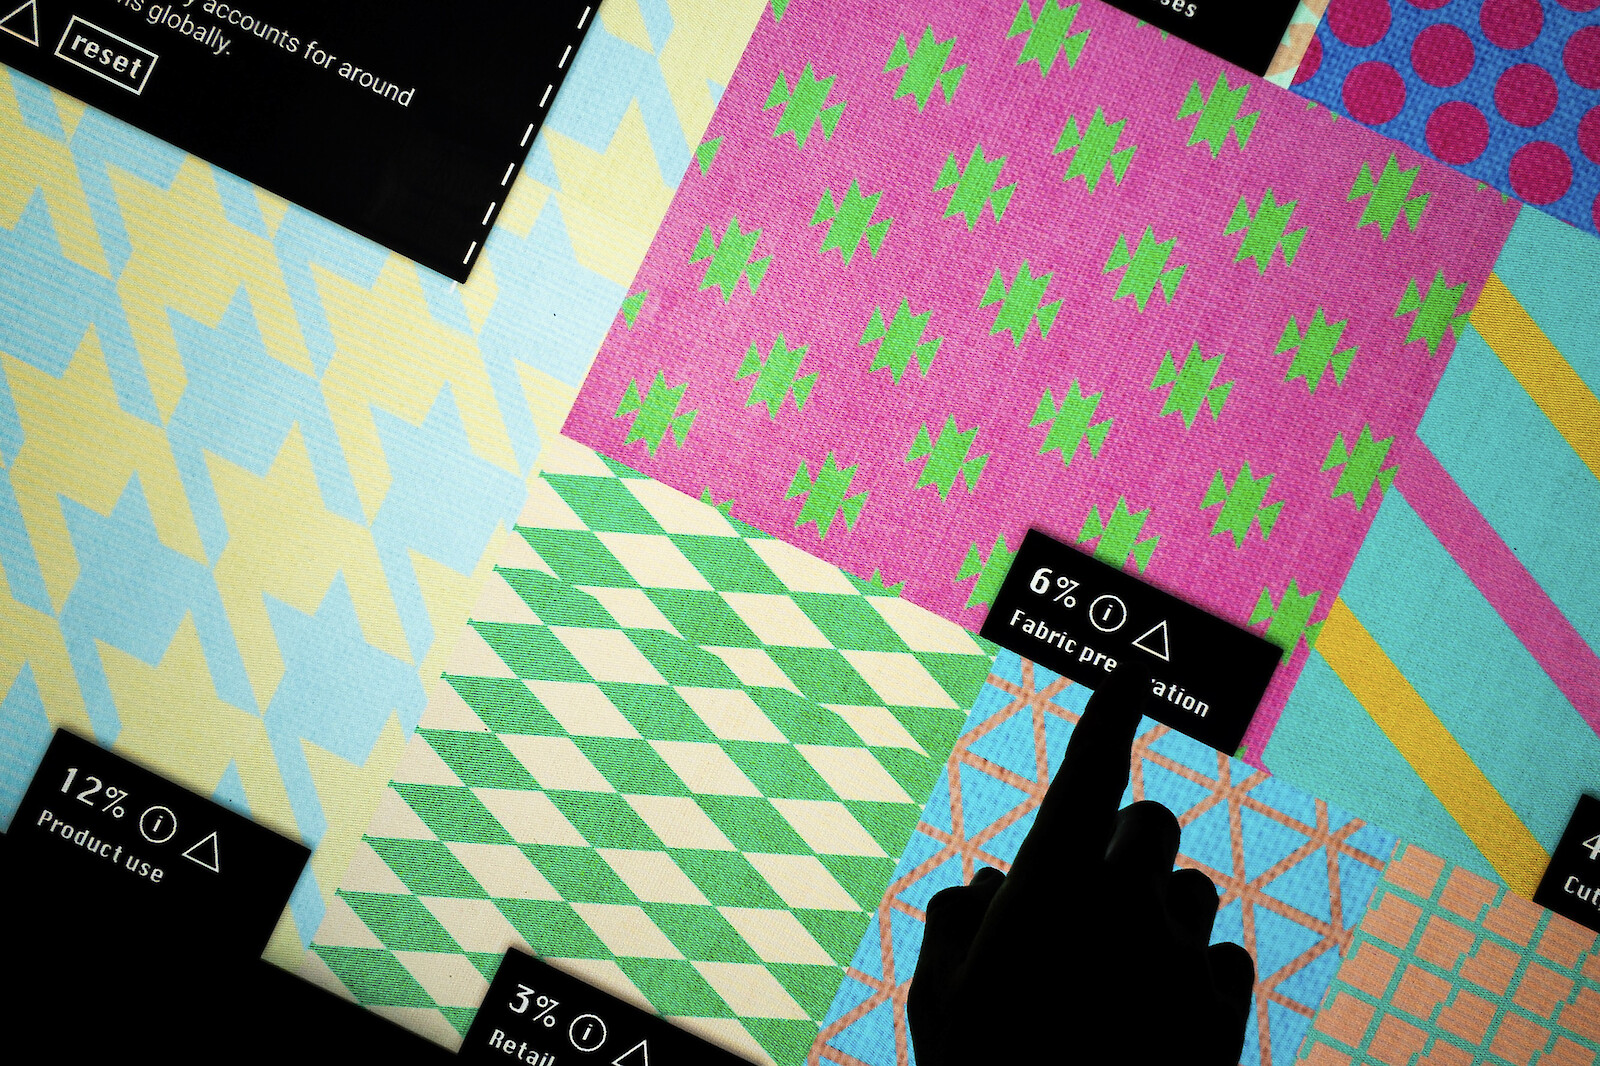
The fashion industry alone accounts for at least 4% of all global co2 emissions. In CUT, MAKE, TRIM the user can learn more about how these emissions can be reduced. When stepping up to the table, the user sees a patchwork made of colorful fabrics. The patches represent the different factors contributing to these large co2 emissions. The size of the patches correlate directly with the portion the category contributes to the total carbon footprint of the industry.
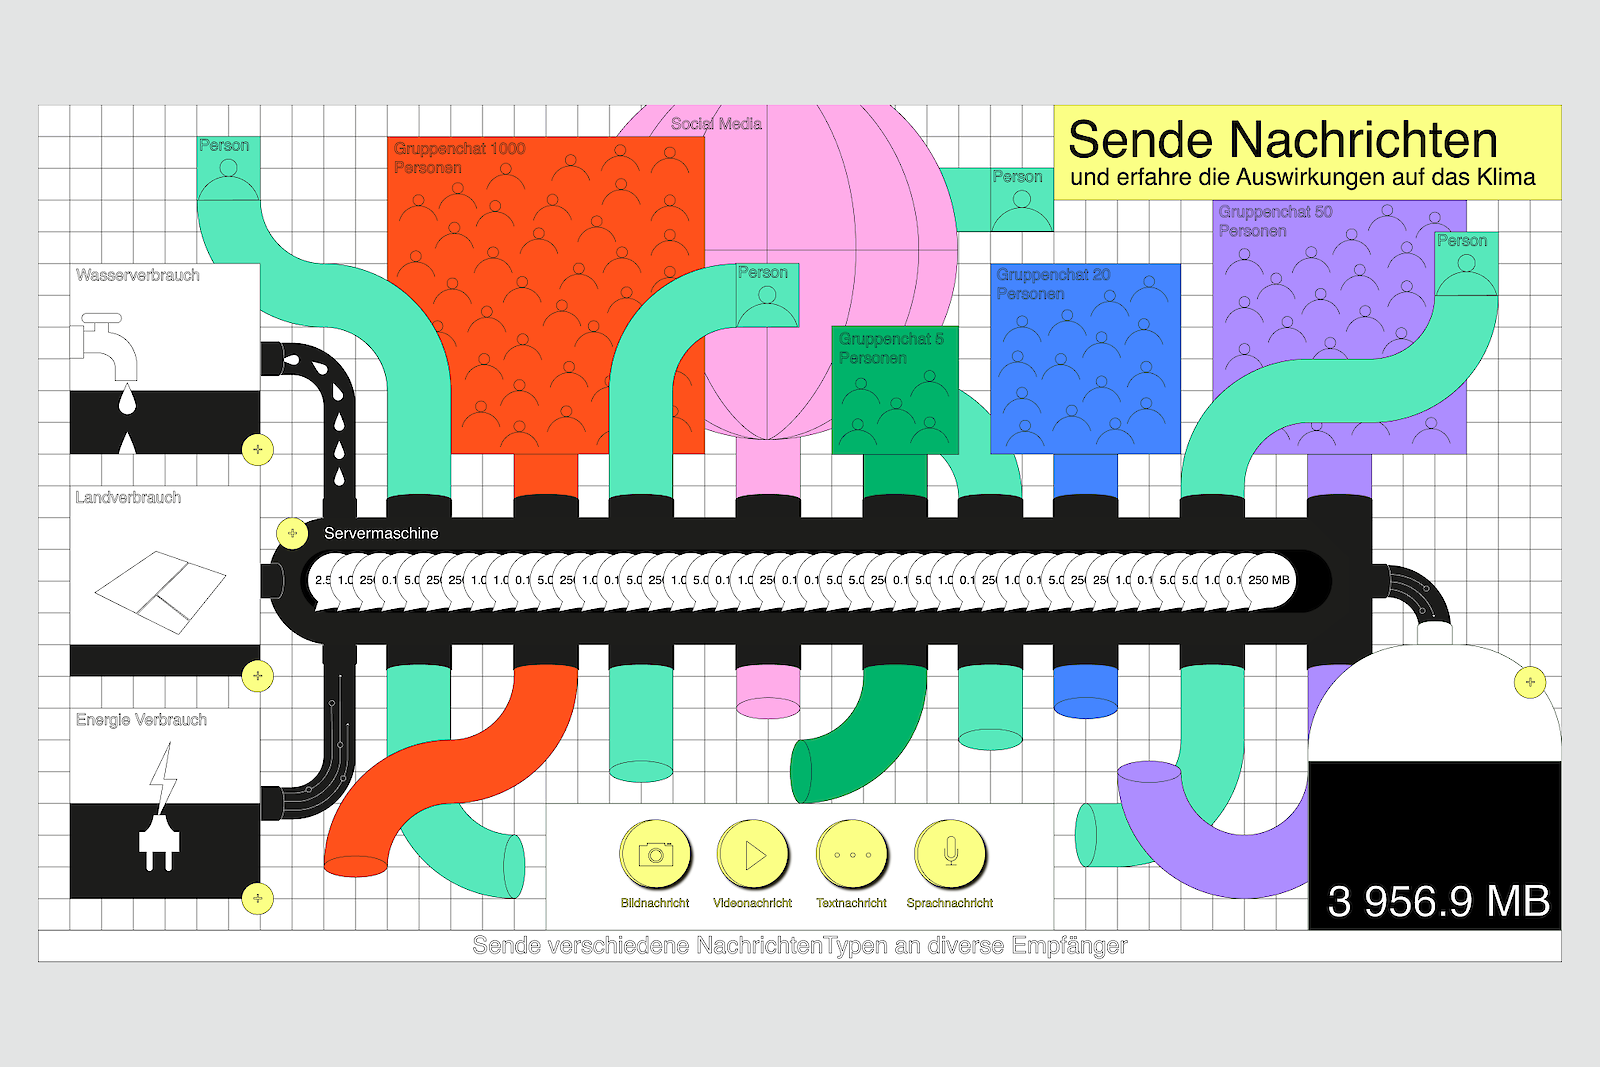
In the common narrative of our environmental impact, data use in the age of the internet is not well presented even though it's a substantial driving force.
With the analogy of sending messages DATA CONVERSATION raises awareness for self caused impact through generating traffic in our daily routine. We visualise the path a message takes to its destination through the maze of infrastructure, which generates CO2 emissions, land and water use. Through the interaction of users in the realm of the internet our actions have varying impacts and we sensitise to consequences which our acting has and where we are giving the control away of the data we produce.
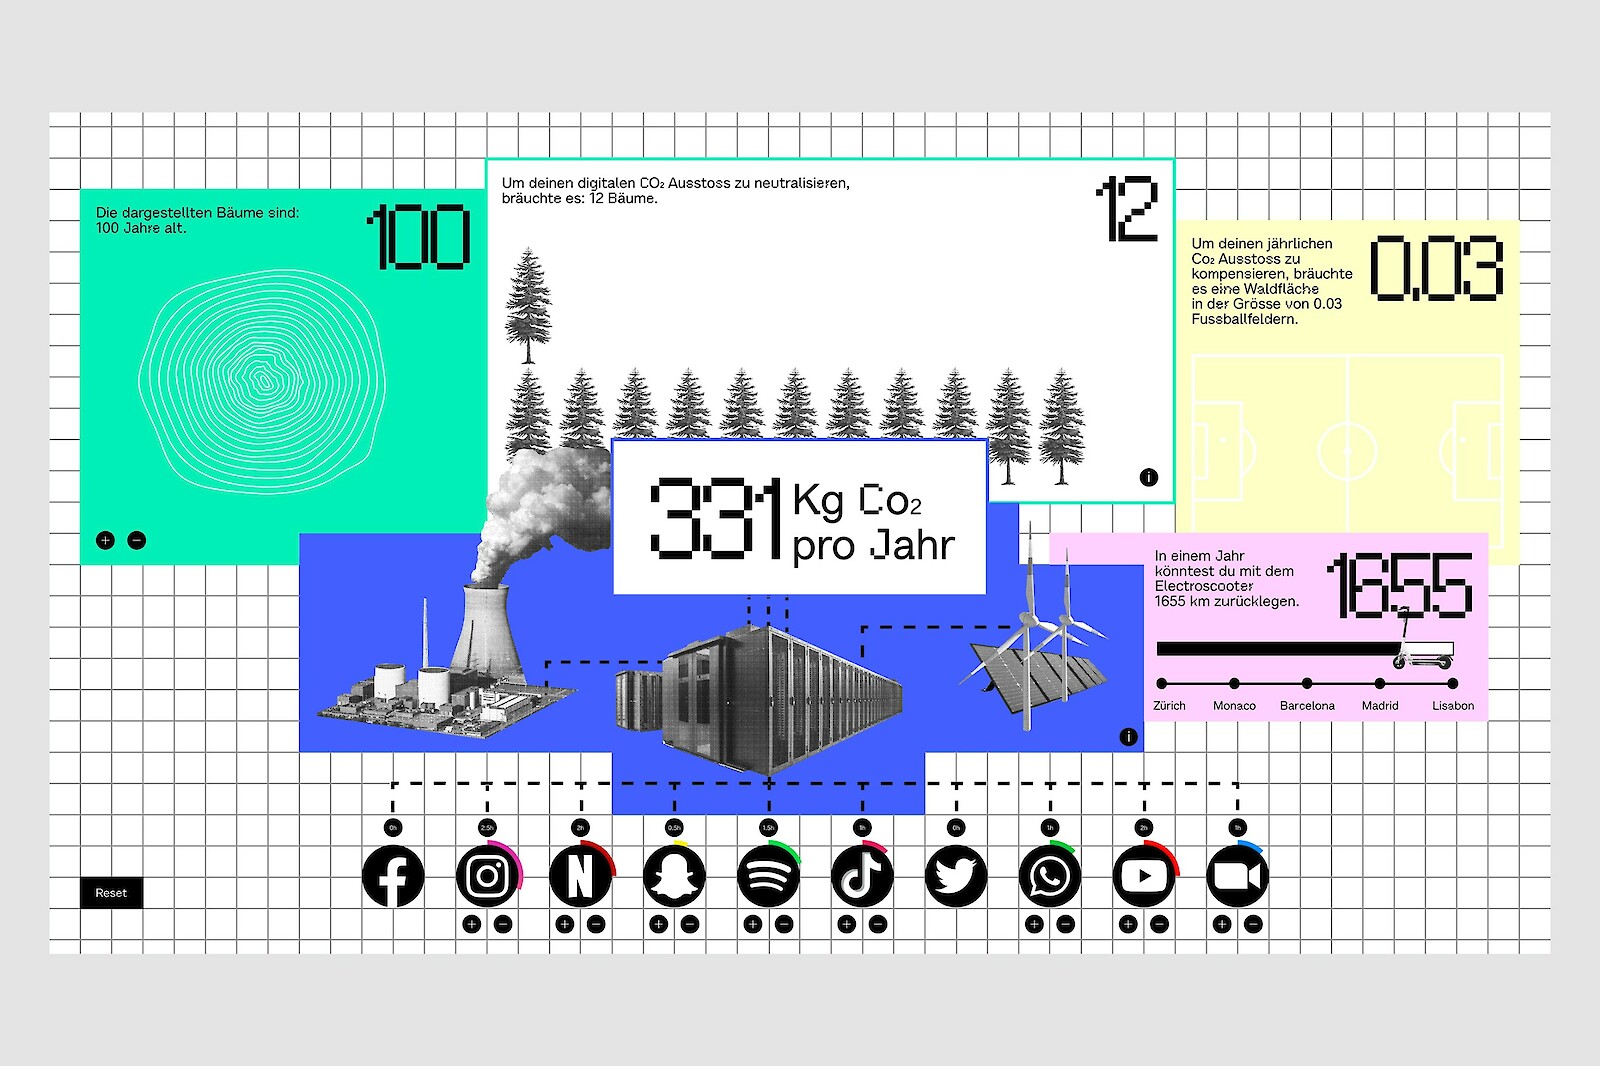
In SCREEN TIME, the user enters the daily hours spent on each app while the application will calculate the yearly CO2 emissions. It will compare the yearly emissions to the amount of trees it would theoretically need to absorb all those emissions. There is also an input field where the user can change the age of the trees to see the impact of the age and the ability of trees absorbing CO2, the message being: Reforesting is good but conserving and protecting existing Forests is better.
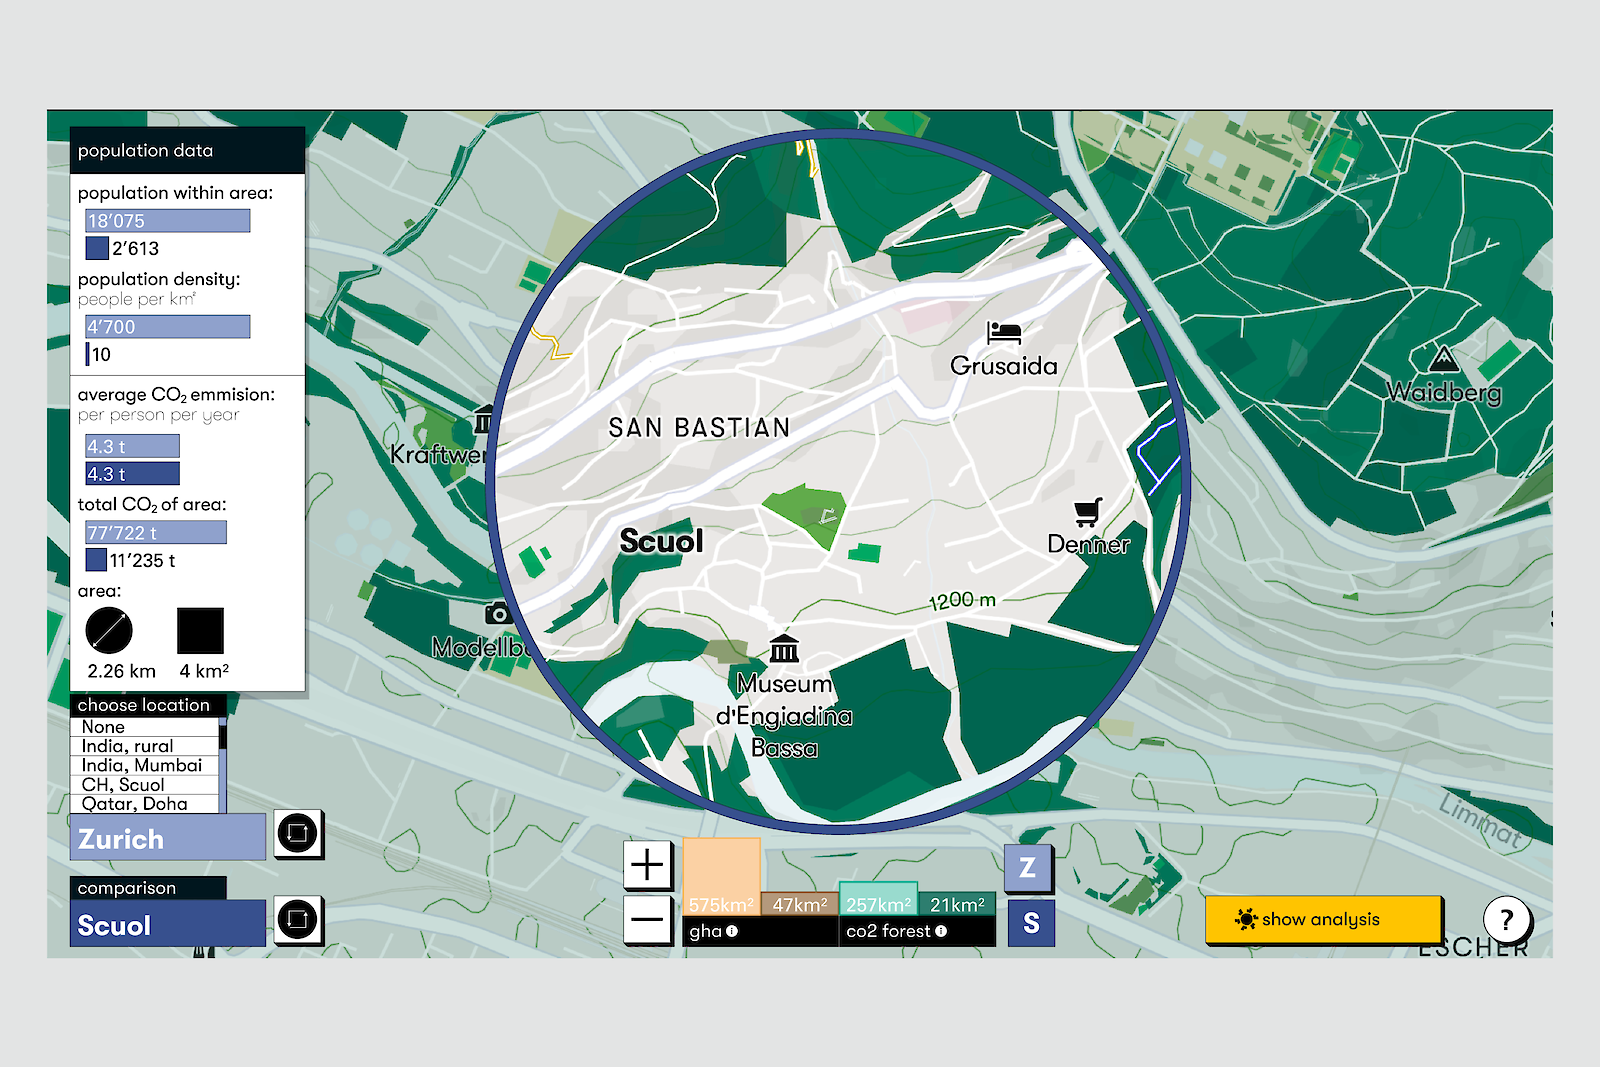
LOCALLOOP focusES on the climate factor of CO2-emissions of an area that is relatable to the user. Therefor the aim is to narrow the analysed space down to a scale, so that the user can find himself in a familiar surrounding. Since the project is presented in Zurich, we chose a 4m2 area around the Toni as the reference and displayed environmental properties which are then compared to an additional space and put in relation to each other.